Outcome
Stock and Cost
Know what you have.What it cost.What every plate makes you.
The figure
2 to 5%
Initial savings, approx. once
Of a year's cost of goods: the plates priced wrong and the dead stock found the first time the menu is costed and the store counted properly.
1 to 3%
Identified savings, approx. a week
Of a week's cost of goods: the variance, the invoice that does not match the order and the price creep the system keeps finding after that.
Modelled arithmetic from the percentages above. Not a measurement and not a promise.
Situations
What changes.
Food cost you find out at month end.
Cost per plate, from your real prices.
Stocktakes on paper.
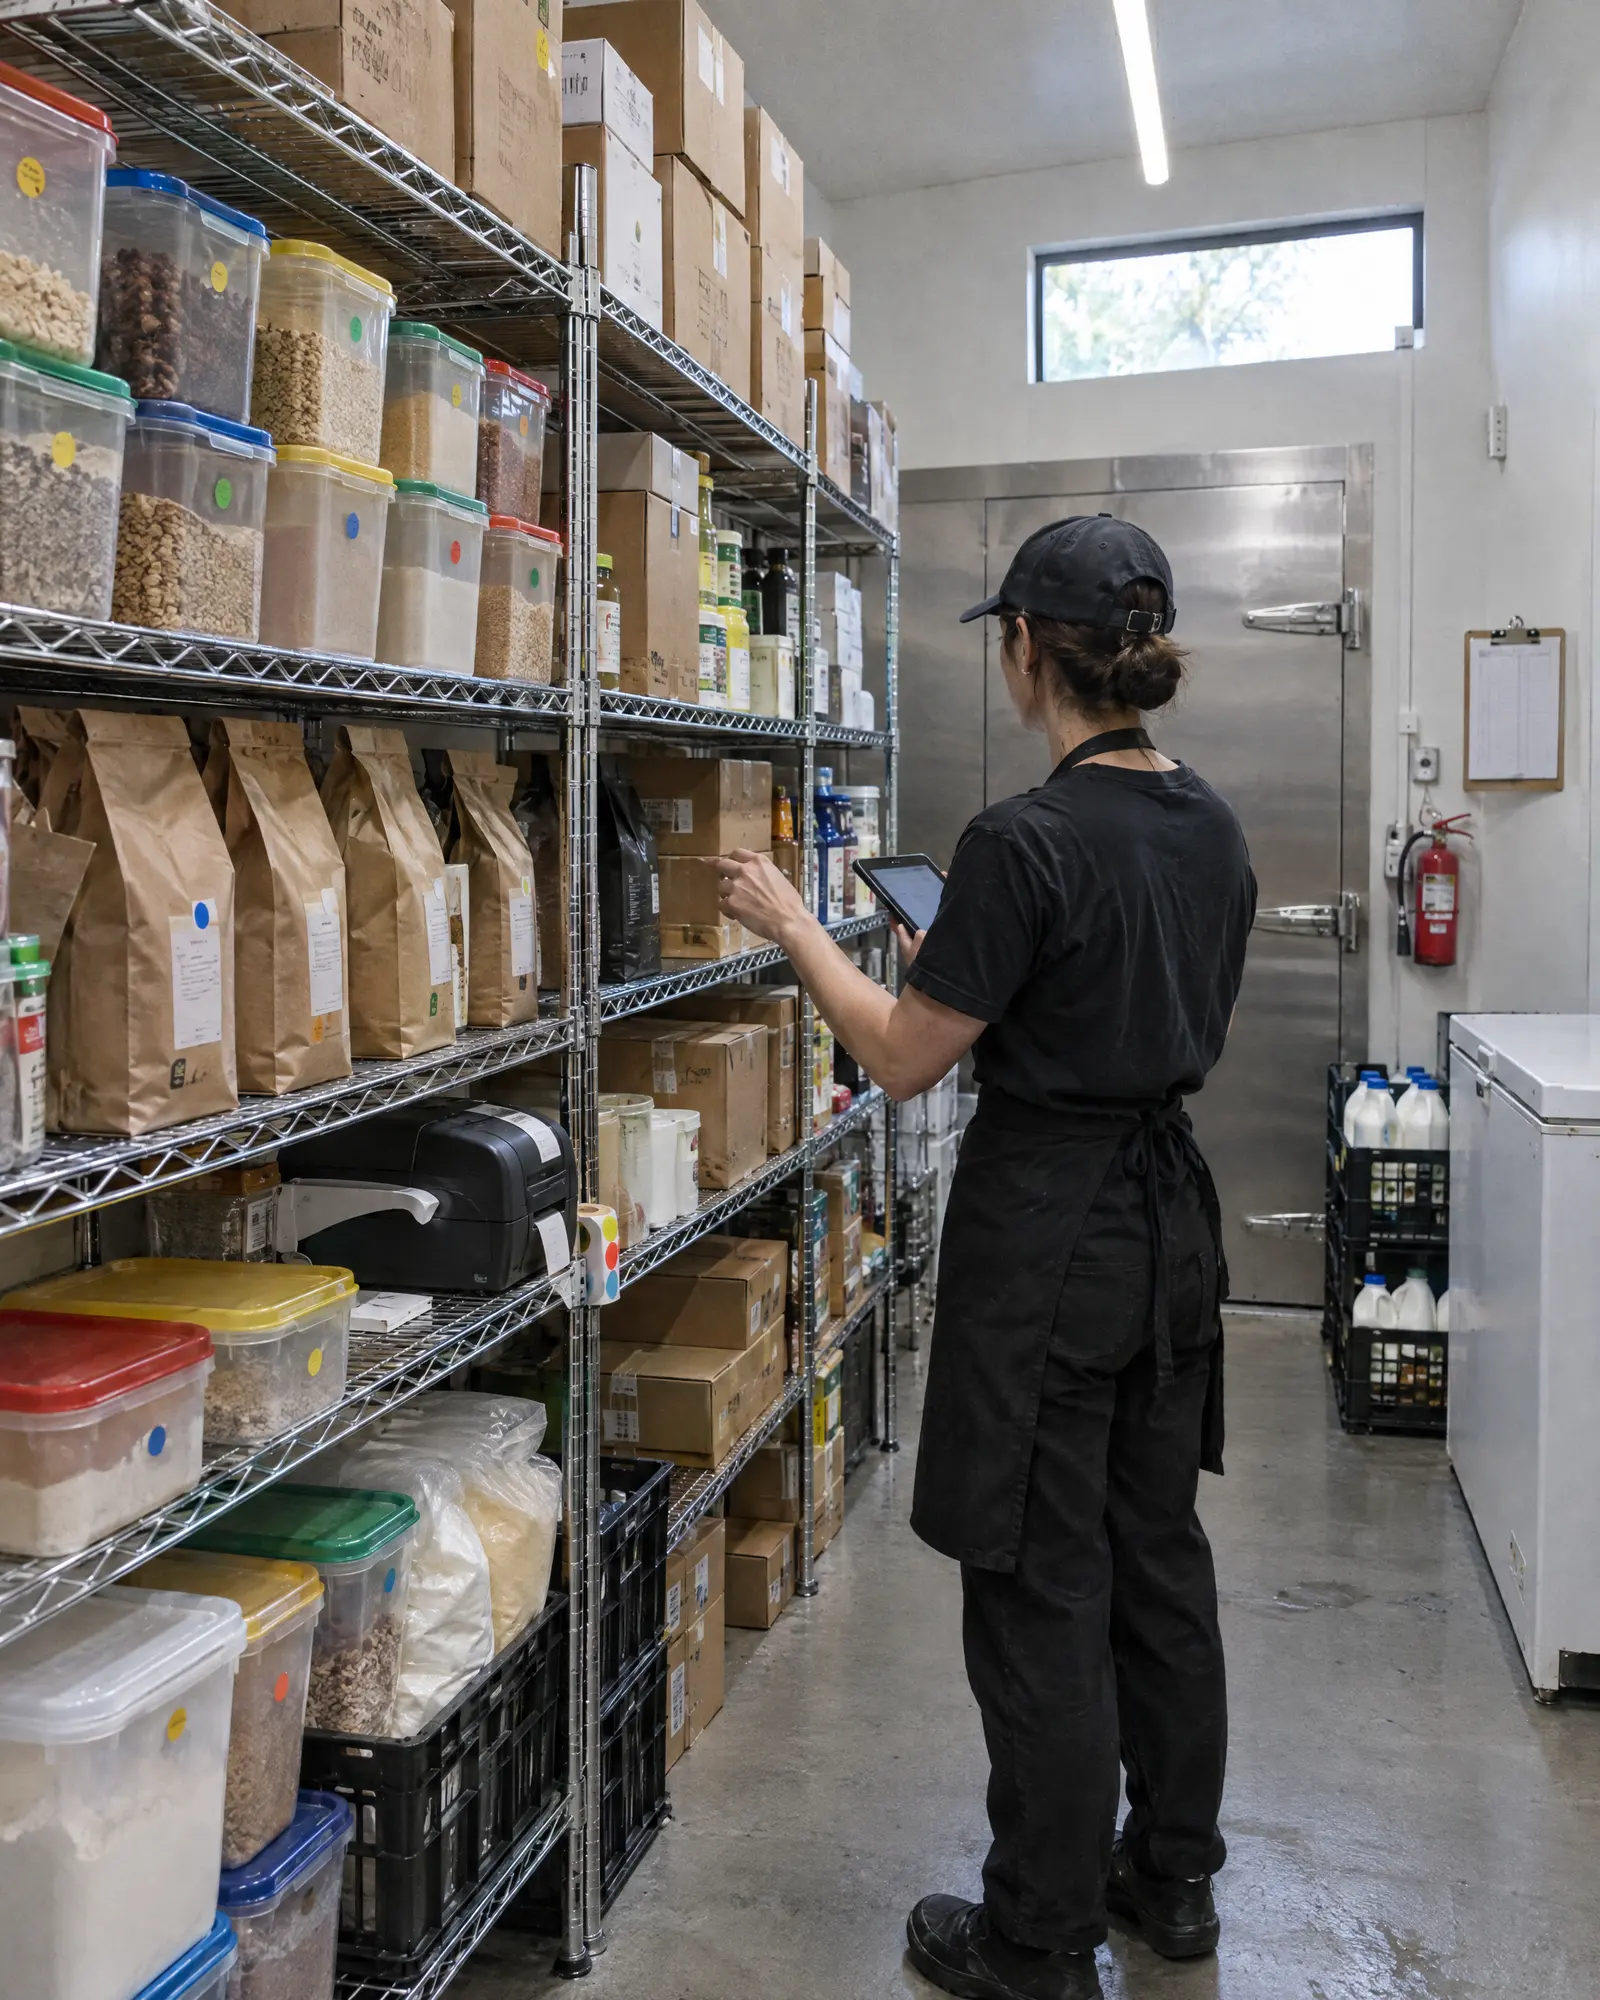
Stocktakes with the variance shown.
Invoices nobody checks against the order.
Invoices matched to orders and deliveries.
- Stocktakes with variance
- Recipe costing and food cost
- Allergens on the FSANZ list